 12 May 2020
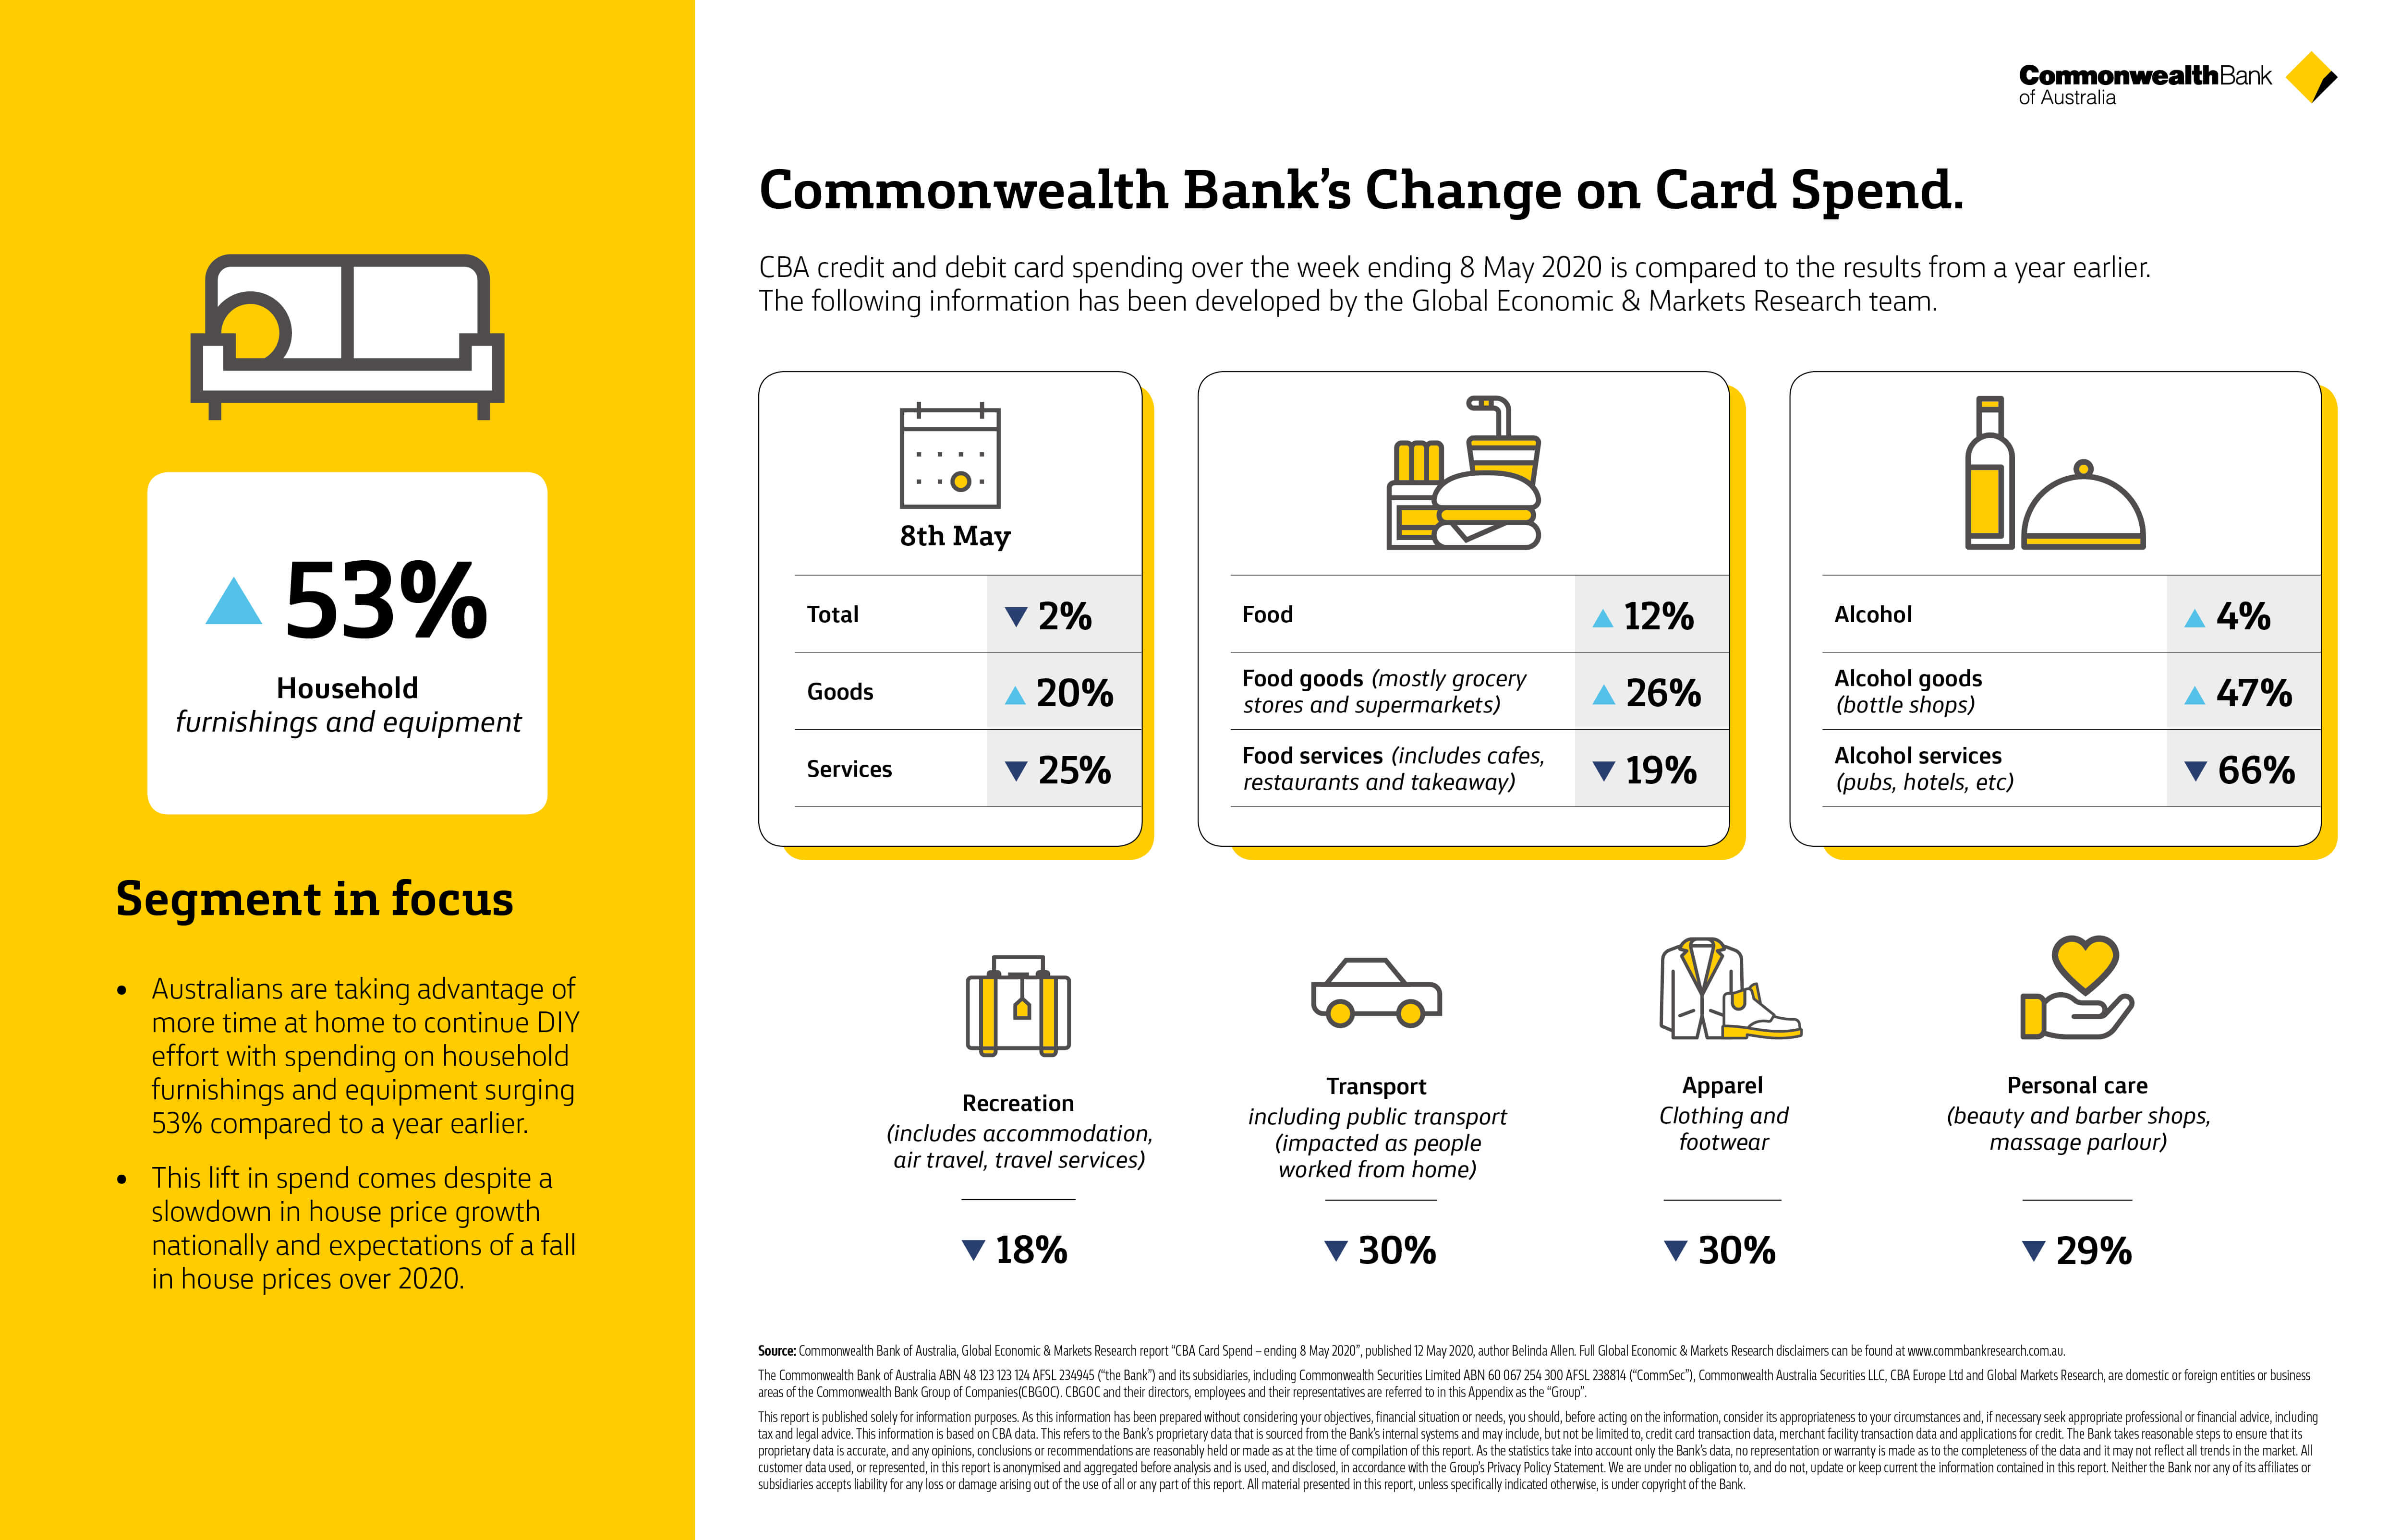
The following article has been developed by the Global Economic & Markets Research team.
Households appear to have stepped up their rate of spending in the second half of April and first week of May 2020 compared with earlier in April.
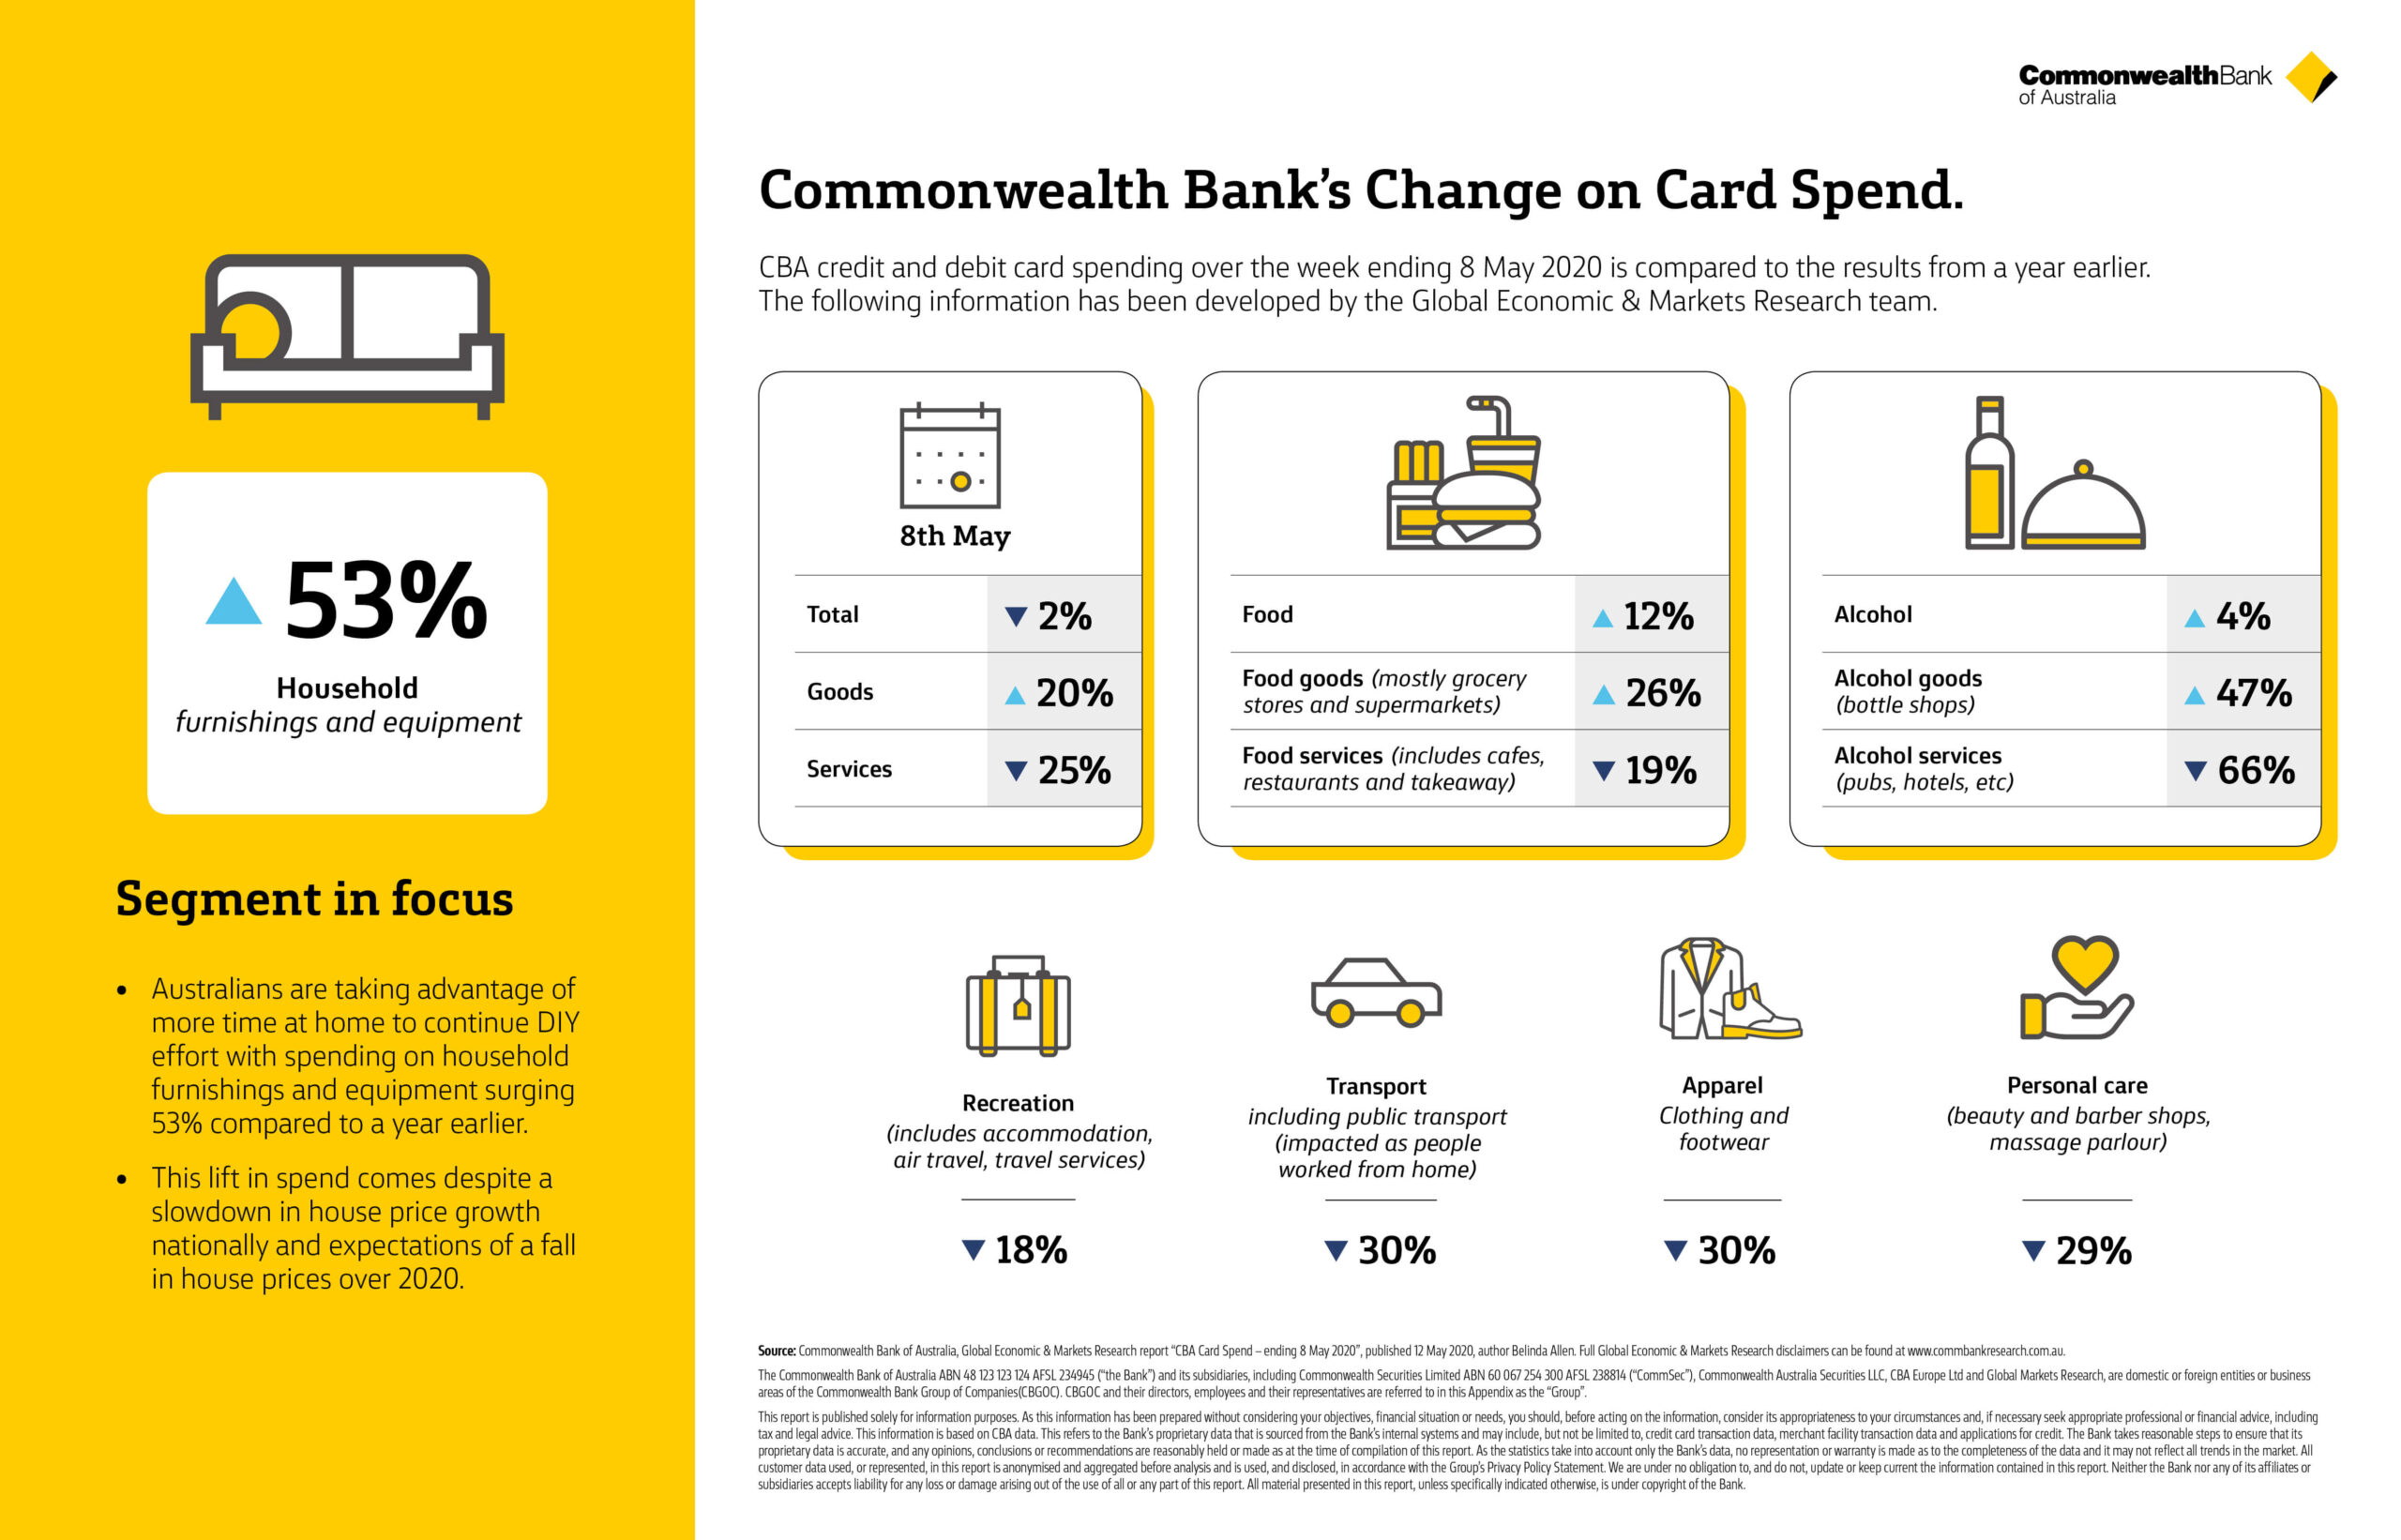
- CommBank credit and debit card spend data for the week ending 8 May indicates household spending is around 2% below a year ago and 10% below its average pace in the first eight weeks of 2020.
- Pent-up demand in the lead-up to Mother’s Day, as well as a preference for contactless payments and spending online rather than cash and instore spending to help control transmission of the virus, could be over-estimating the improved momentum.
- Spending on household furnishings and equipment continues to lift. The more time we spend at home, it seems the more we want to make changes to it.
As was the case last week, CommBank analysis of CBA credit and debit card spending data suggests household spending has shifted gears. Total card spend remains lower than a year ago, but the annual rate of change has picked up again, meaning spending is now ‘less bad’.
Compared with the same week a year ago, spending is down by around 2%. That is much better than in mid-April 2020, when spending was down by almost 20% on the previous year’s levels.
Comparing card spending data with earlier this year gives a better picture
However, in reality, household expenditure in April and May 2019 was lacklustre due to:
- Considerable uncertainty in the lead up to the Federal Election on 18 May 2019
- House prices had been falling for almost 18 months
- The unemployment rate was rising
- The Reserve Bank of Australia cut the cash rate in June 2019, however there was plenty of speculation about an earlier rate cut at this time.
For these reasons, we suggest that comparing current spending with average spending in the first eight weeks of 2020, before the coronavirus outbreak and economic shutdown measures, provides a more accurate picture. As the Australian economy started to show a gentle turning point in early 2020, household spending was running around 8% higher than a year ago. Using this as our comparator base indicates that household spending is currently 10% lower.
Spending in the week ending 8 May 2020
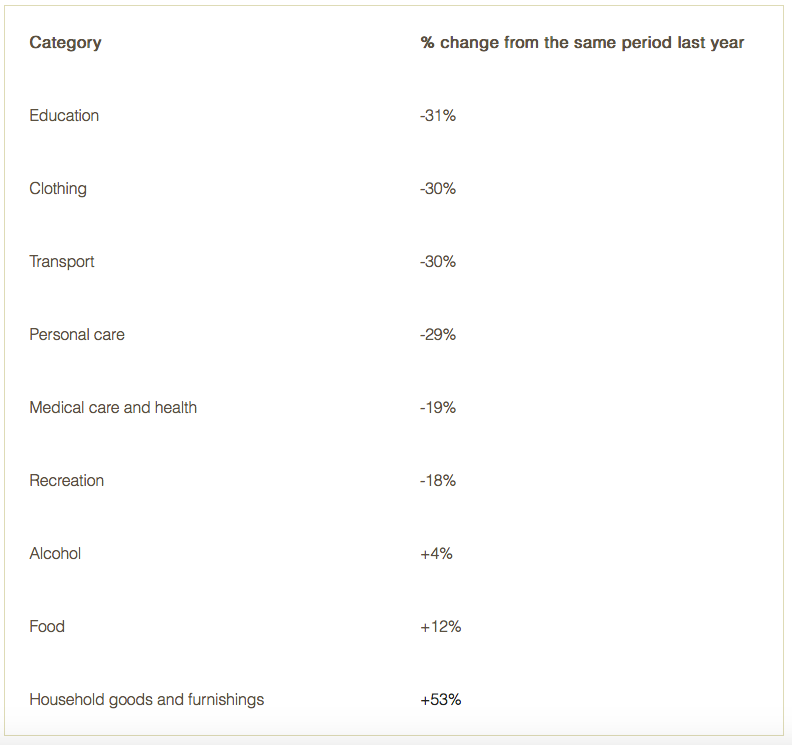
The Northern Territory, Tasmania, South Australia and Western Australia all recorded positive spending growth in the week ending 8 May compared with a year earlier, as did Queensland with its earlier rollback from shutdown measures. However in the same week spending in NSW was down 4% compared with a year earlier, below the national average of a 2% fall, while spending in the ACT and Victoria was down 7%.
We expect to see more spending shifts reflected in the spending data as restrictions are progressively eased in each state. In particular, we could see a further lift in instore purchases as more major shops reopen and consumers rebuild some confidence to spend. Some states are reopening cafes and restaurants for limited use. Any further easing in restrictions, coupled with more positive news on falling coronavirus infection rates, could be expected to further support household expenditure in the near-term.
Why is this information helpful?
CommBank weekly credit and debit card spend data gives you an up-to-date picture of what people are spending their money on and how this is changing as the coronavirus impacts our world and the economy.
We will be providing further updates to help you understand the impact that the virus is having on businesses and the broader economy.
Source: Commonwealth Bank of Australia, Global Economic & Markets Research report “CBA Card Spend – ending 8 May 2020”, published 12 May 2020, author Belinda Allen. Full Global Economic & Markets Research disclaimers can be found at www.commbankresearch.com.au.